
Every geom
One function for each ggplot2 4.0 geom, drawn in black ink.
Each takes a matplotlib Axes first; extra keywords go to matplotlib.
All data are synthetic.
49 panels, from
examples/gallery.py.
With toggle worn on (top right) each is shown as save_vintage saves it.The shared setup code (data used by the panels below)
rng = np.random.default_rng(7)
x = rng.normal(0, 1, 150)
y = 0.6 * x + rng.normal(0, 0.8, 150)
grp = np.where(rng.random(150) < 0.5, "a", "b")
xs = np.linspace(0, 10, 25)
ys = np.sin(xs) + 1.5
X, Y = np.meshgrid(np.linspace(-2, 2, 80), np.linspace(-2, 2, 80))
Z = np.exp(-(X**2 + Y**2)) - 0.6 * np.exp(-((X - 1) ** 2 + (Y + 0.8) ** 2) / 0.4)


def map_regions(nx=5, ny=4, seed=3):
    """Non-overlapping synthetic regions: cells of a jittered grid."""
    r = np.random.default_rng(seed)
    gx, gy = np.meshgrid(np.linspace(0, 1, nx + 1), np.linspace(0, 0.8, ny + 1))
    inner = (gx > 0) & (gx < 1) & (gy > 0) & (gy < 0.8)
    gx = gx + inner * r.uniform(-0.06, 0.06, gx.shape)
    gy = gy + inner * r.uniform(-0.05, 0.05, gy.shape)
    return [
        np.array(
            [
                [gx[j, i], gy[j, i]],
                [gx[j, i + 1], gy[j, i + 1]],
                [gx[j + 1, i + 1], gy[j + 1, i + 1]],
                [gx[j + 1, i], gy[j + 1, i]],
            ]
        )
        for j in range(ny)
        for i in range(nx)
    ]


polys = map_regions()
geom_point
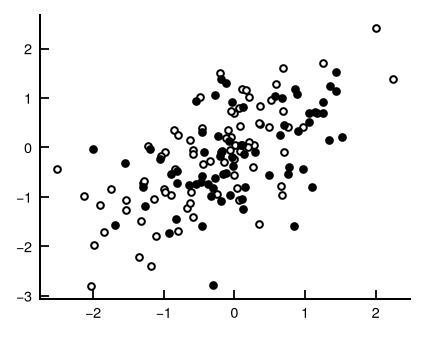
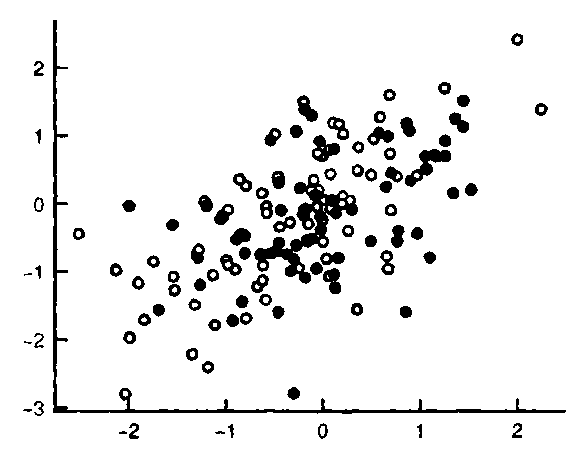
g.geom_point(ax, x, y, grp, size=3)
geom_pointgeom_jitter
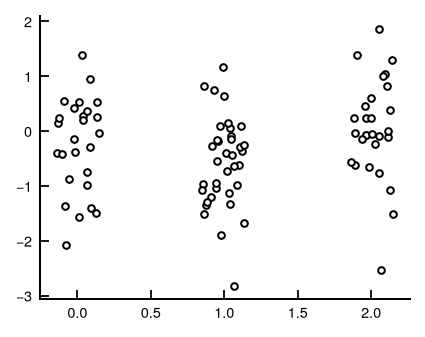
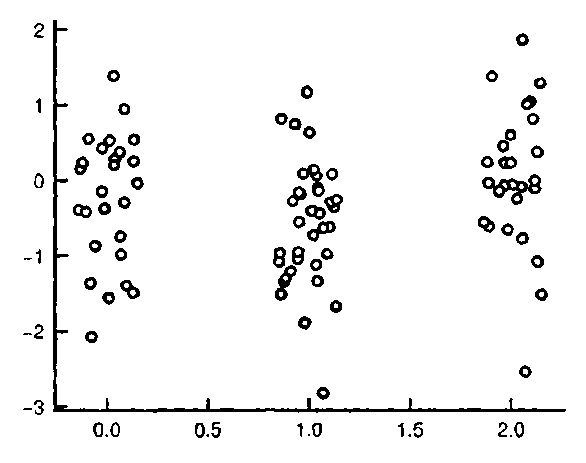
g.geom_jitter(ax, rng.integers(0, 3, 90), rng.normal(0, 1, 90), size=3)
geom_jittergeom_count
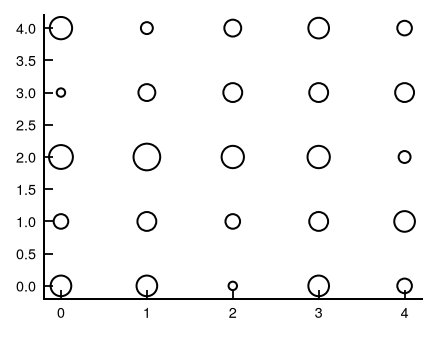
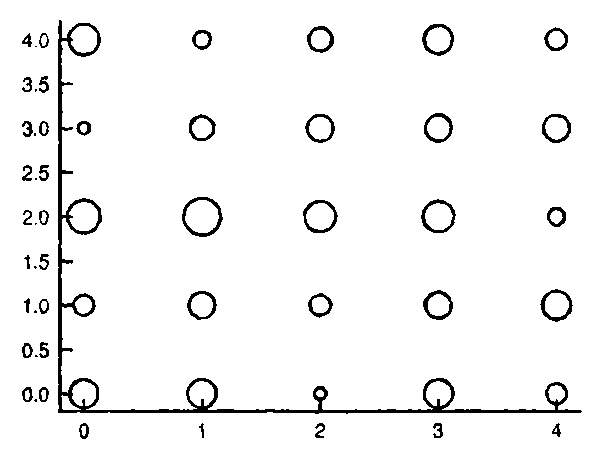
g.geom_count(ax, rng.integers(0, 5, 120), rng.integers(0, 5, 120))
geom_countgeom_line
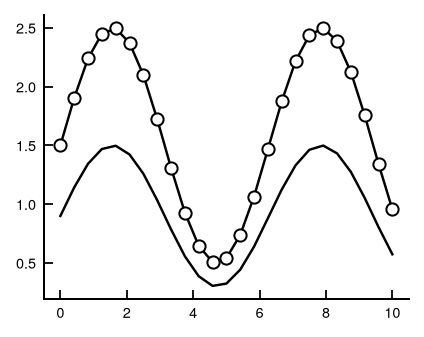
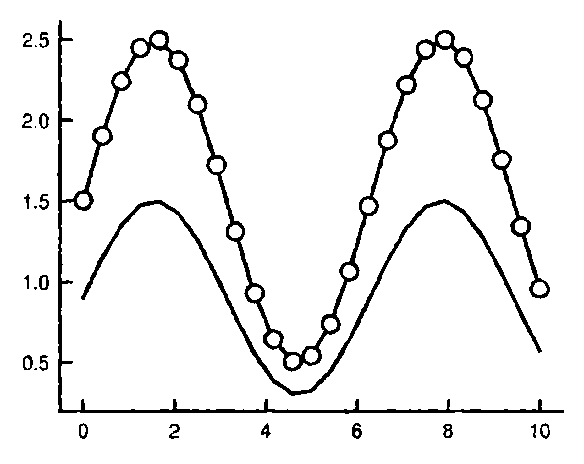
g.geom_line(ax, xs, ys, markers=True)
g.geom_line(ax, xs, ys * 0.6, markers=False)
geom_linegeom_path
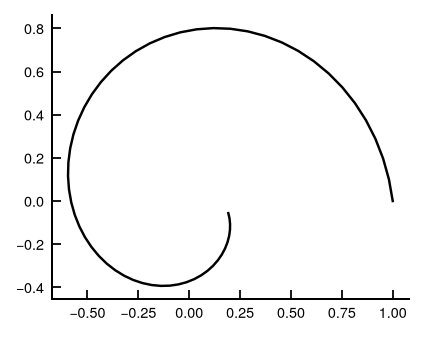
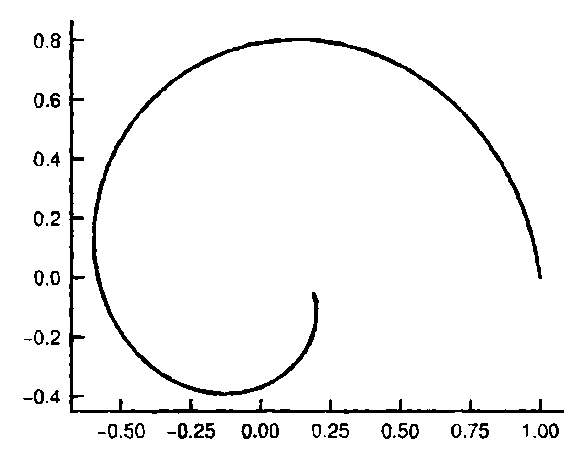
g.geom_path(ax, np.cos(np.linspace(0, 6, 60)) * np.linspace(1, 0.2, 60), np.sin(np.linspace(0, 6, 60)) * np.linspace(1, 0.2, 60))
geom_pathgeom_step
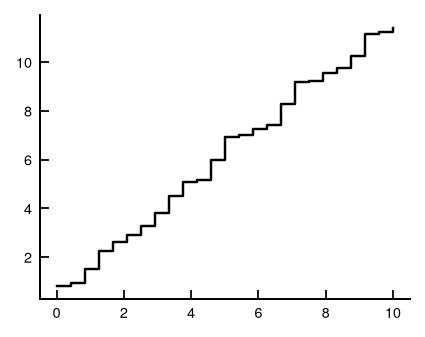
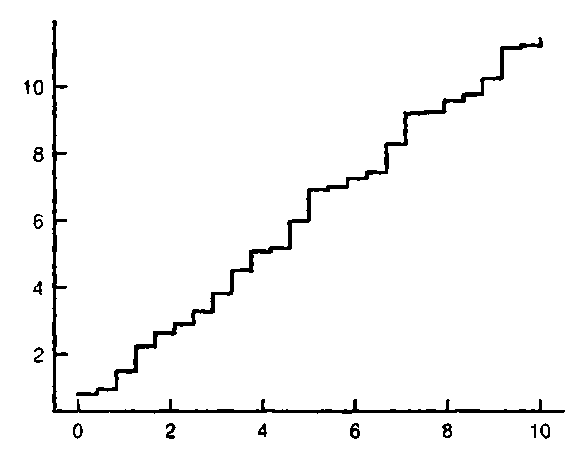
g.geom_step(ax, xs, np.cumsum(rng.random(25)))
geom_stepgeom_abline
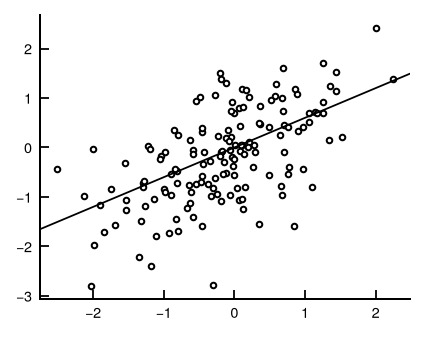
g.geom_point(ax, x, y, size=2.5)
g.geom_abline(ax, 0, 0.6)
geom_point, geom_ablinegeom_hline/vline
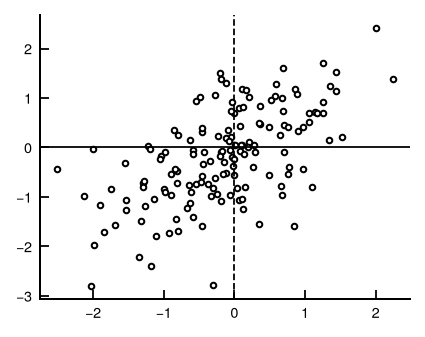
g.geom_point(ax, x, y, size=2.5)
g.geom_hline(ax, 0)
g.geom_vline(ax, 0, linestyle='--')
geom_point, geom_hline, geom_vlinegeom_segment
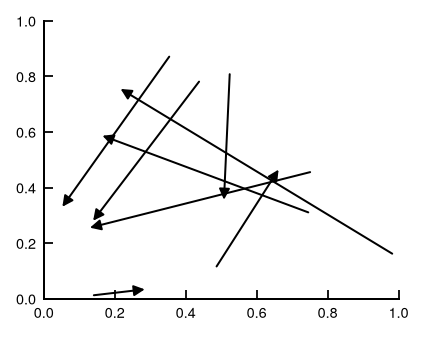
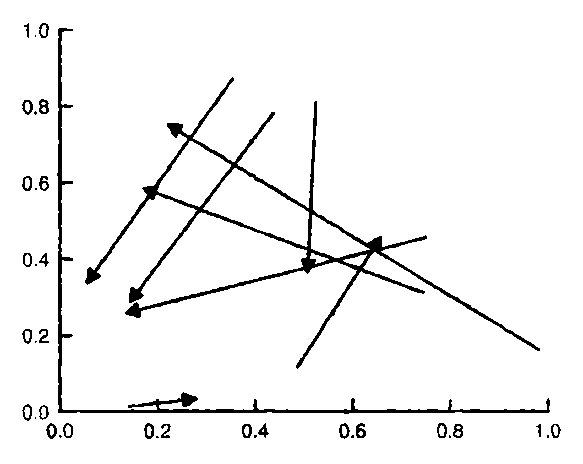
g.geom_segment(ax, rng.random(8), rng.random(8), rng.random(8), rng.random(8), arrow=True)
geom_segmentgeom_curve
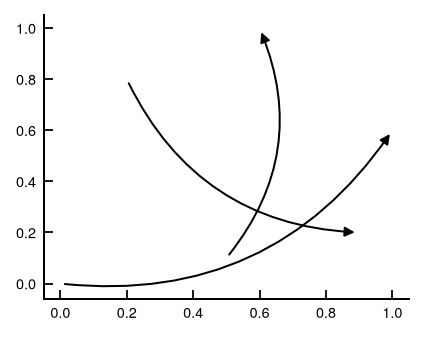
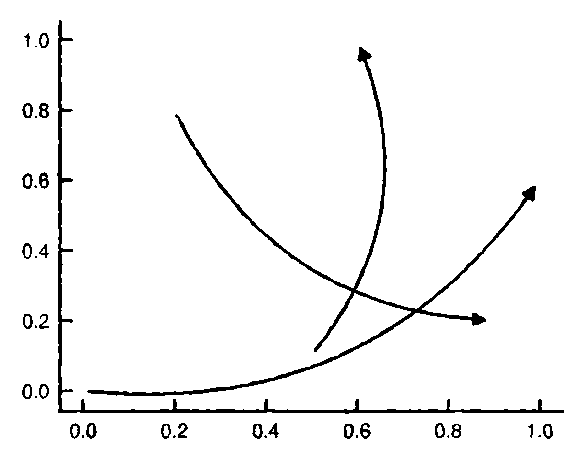
g.geom_curve(ax, [0, 0.2, 0.5], [0, 0.8, 0.1], [1, 0.9, 0.6], [0.6, 0.2, 1])
geom_curvegeom_spoke
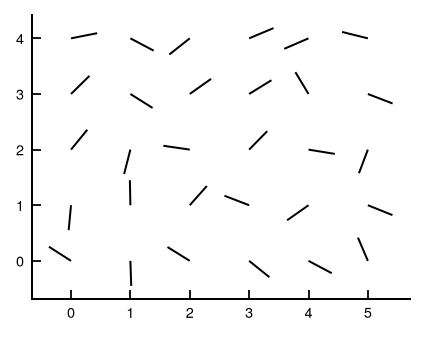
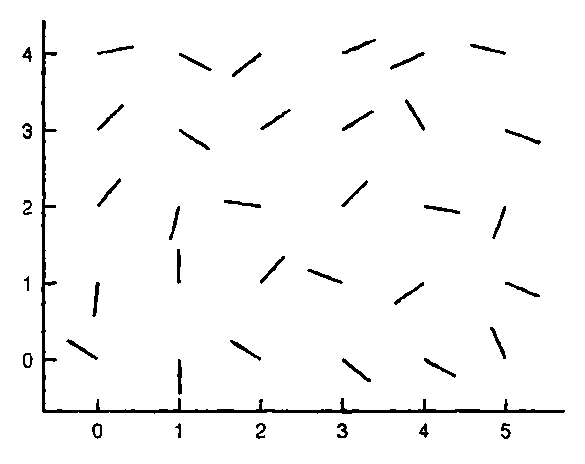
g.geom_spoke(ax, np.tile(np.arange(6), 5), np.repeat(np.arange(5), 6), rng.uniform(0, 2 * np.pi, 30), 0.45)
geom_spokegeom_function
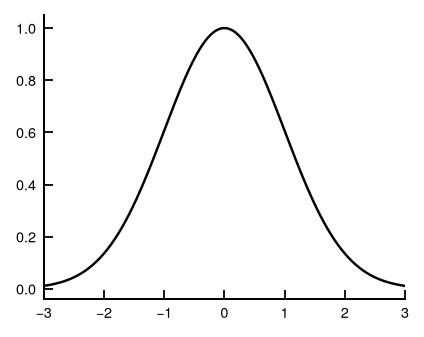
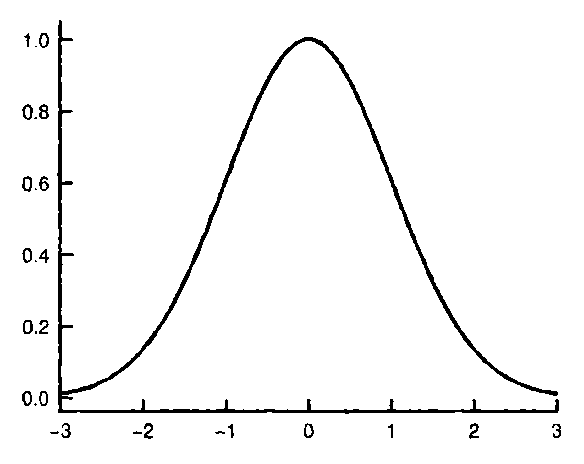
ax.set_xlim(-3, 3)
g.geom_function(ax, lambda t: np.exp(-t ** 2 / 2), (-3, 3))
geom_functiongeom_rug
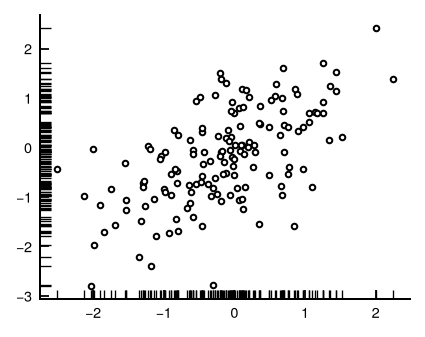
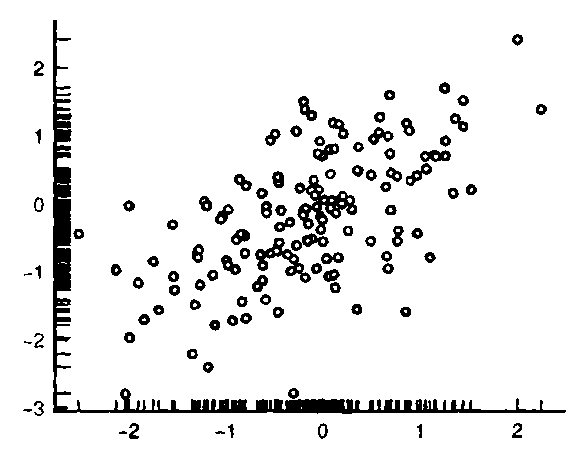
g.geom_point(ax, x, y, size=2.5)
g.geom_rug(ax, x, y)
geom_point, geom_ruggeom_area
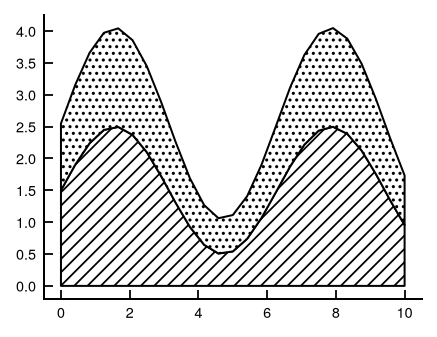
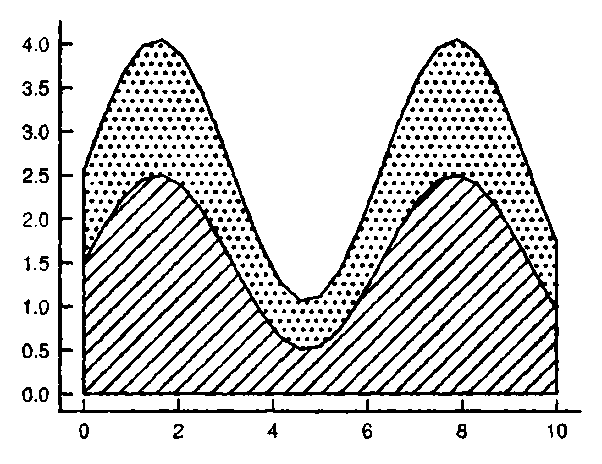
g.geom_area(ax, np.r_[xs, xs], np.r_[ys, ys * 0.5 + 0.3], np.r_[['a'] * 25, ['b'] * 25])
geom_areageom_ribbon
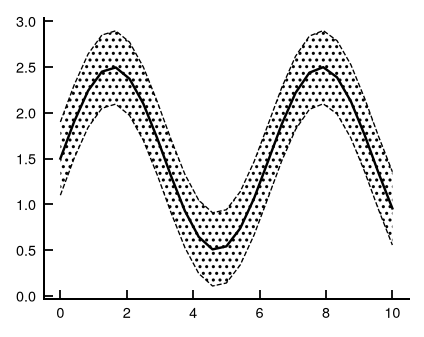
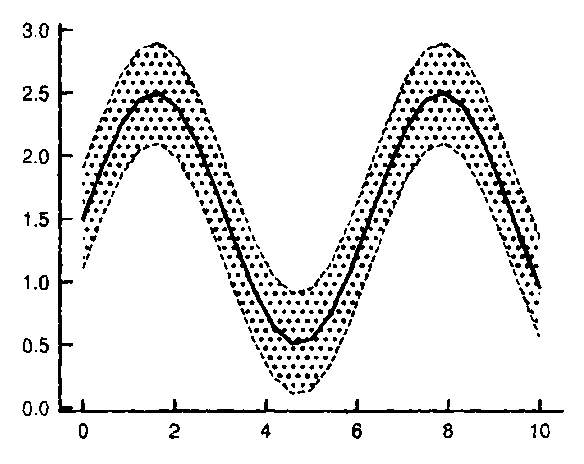
g.geom_ribbon(ax, xs, ys - 0.4, ys + 0.4)
g.geom_line(ax, xs, ys)
geom_ribbon, geom_linegeom_rect
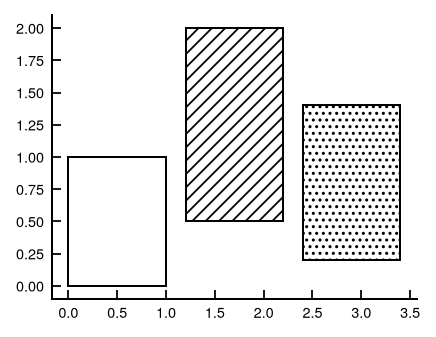
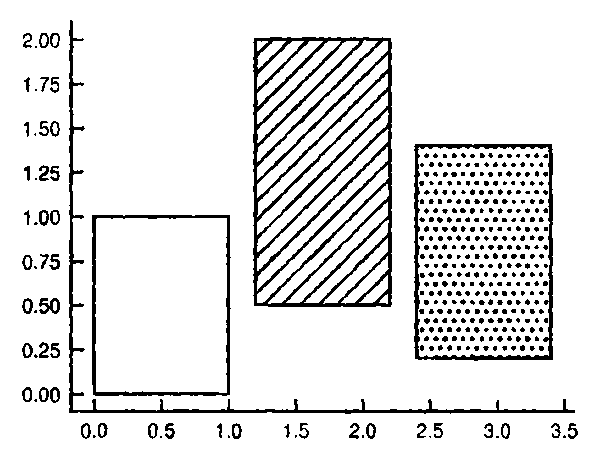
g.geom_rect(ax, [0, 1.2, 2.4], [1, 2.2, 3.4], [0, 0.5, 0.2], [1, 2, 1.4], ['a', 'b', 'c'])
geom_rectgeom_polygon
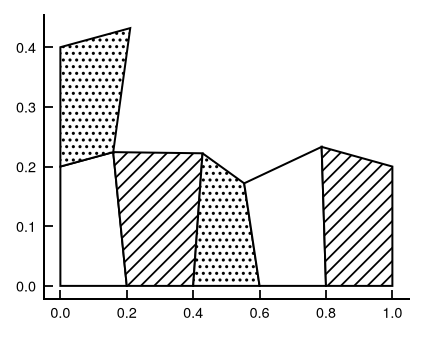
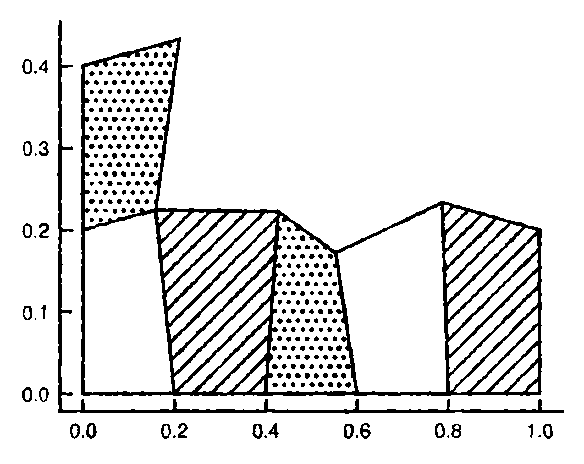
g.geom_polygon(ax, polys[:6], ['a', 'b', 'c', 'a', 'b', 'c'])
geom_polygongeom_col
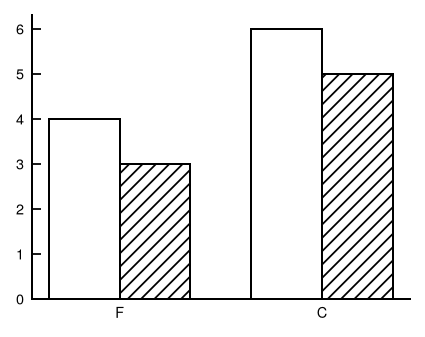
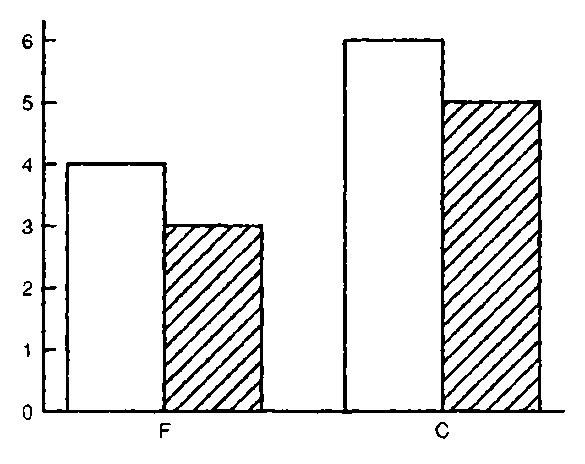
g.geom_col(ax, ['F', 'C', 'F', 'C'], [4, 6, 3, 5], ['vis', 'vis', 'aud', 'aud'])
geom_colgeom_bar
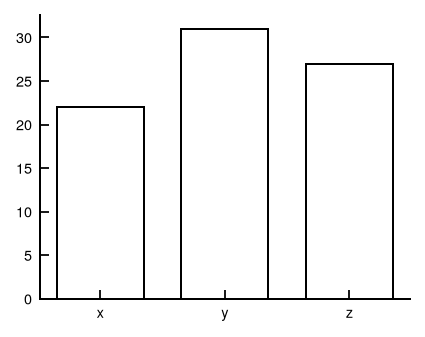
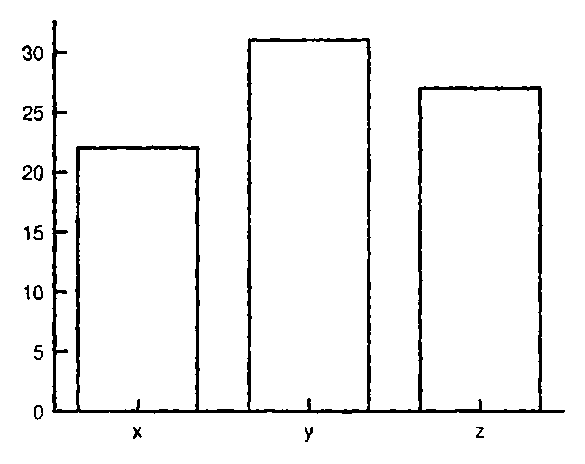
g.geom_bar(ax, rng.choice(['x', 'y', 'z'], 80))
geom_bargeom_histogram
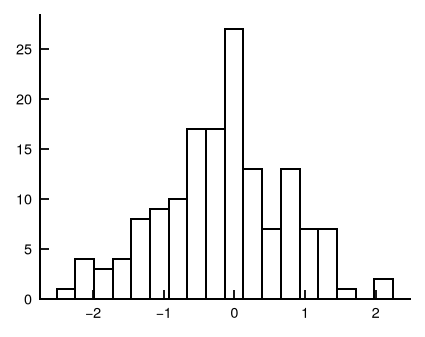
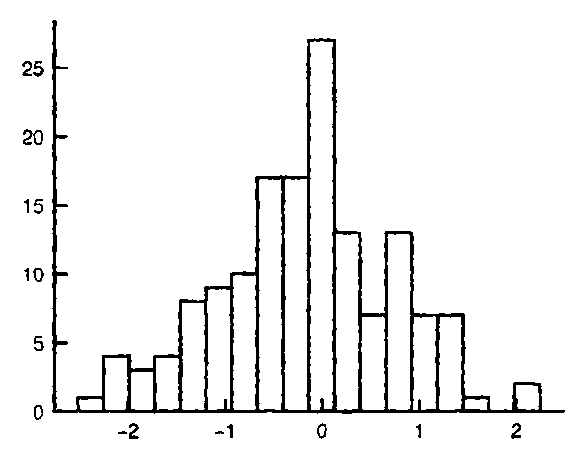
g.geom_histogram(ax, x, bins=18)
geom_histogramgeom_histogram (grouped)
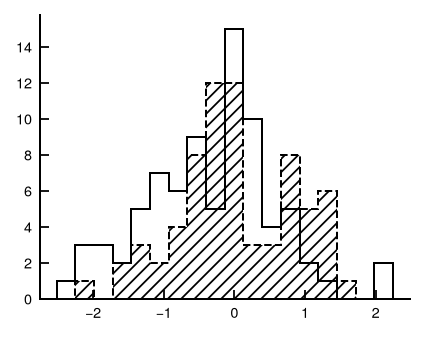
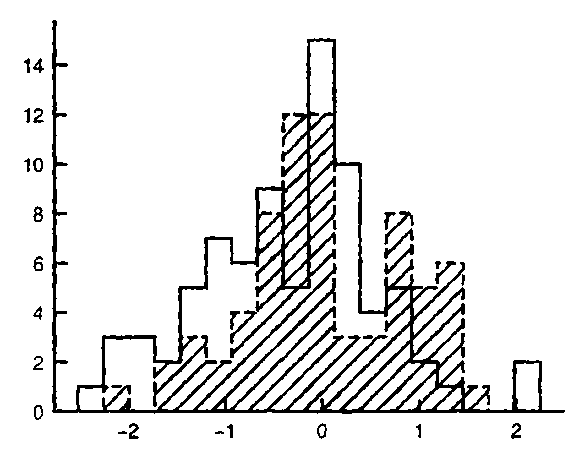
g.geom_histogram(ax, x, grp, bins=18)
geom_histogramgeom_freqpoly
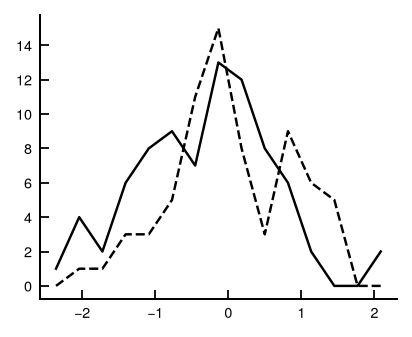
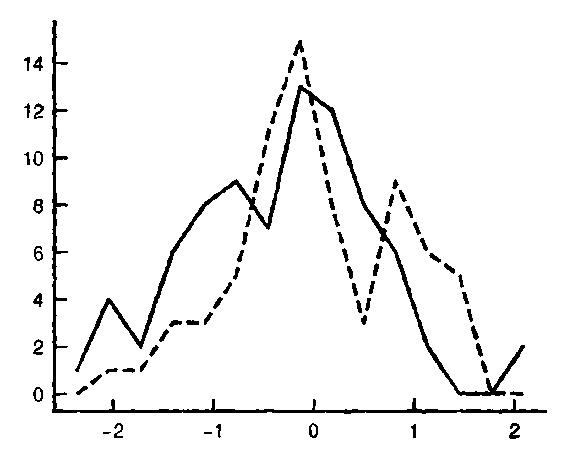
g.geom_freqpoly(ax, x, grp, bins=15)
geom_freqpolygeom_density
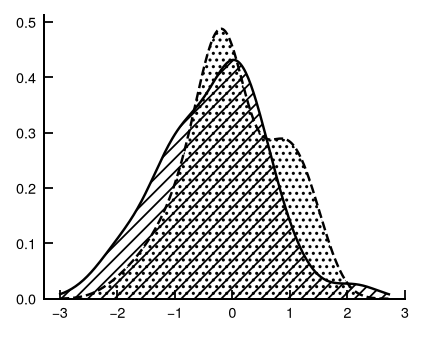
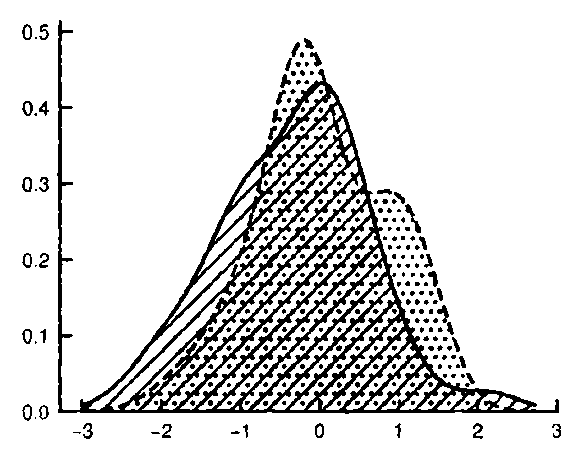
g.geom_density(ax, x, grp, hatch=True)
geom_densitygeom_dotplot
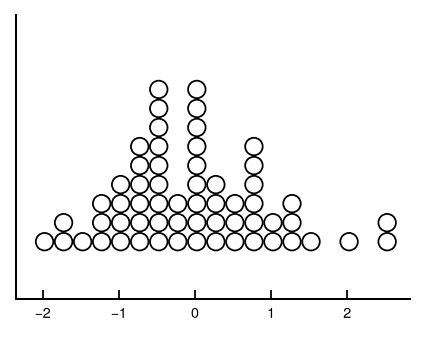
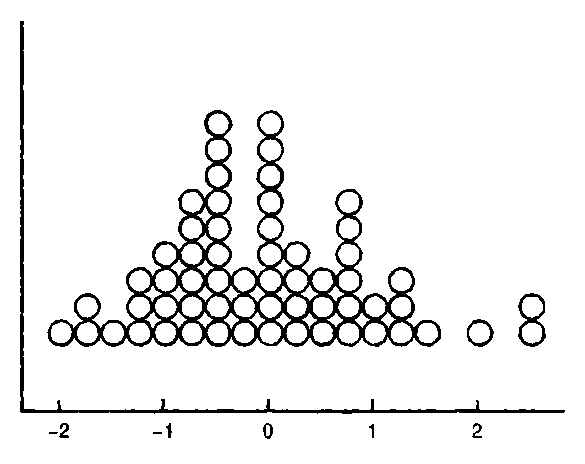
g.geom_dotplot(ax, rng.normal(0, 1, 60), binwidth=0.25)
geom_dotplotgeom_boxplot
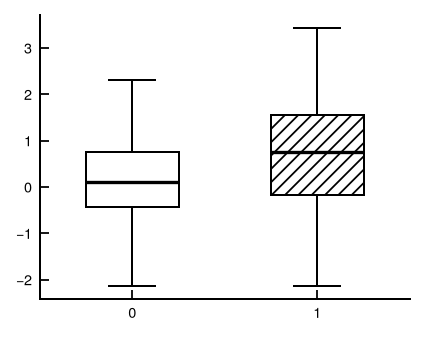
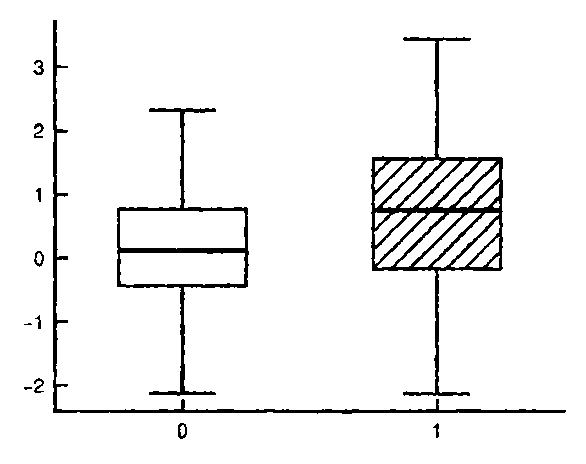
g.geom_boxplot(ax, [rng.normal(0, 1, 80), rng.normal(0.8, 1.3, 80)])
geom_boxplotgeom_violin
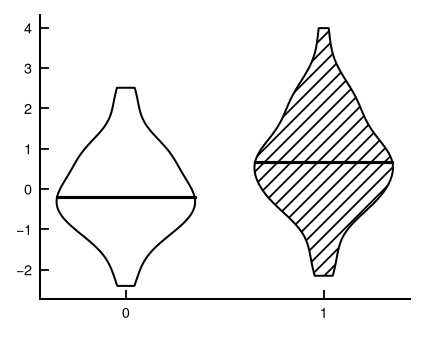
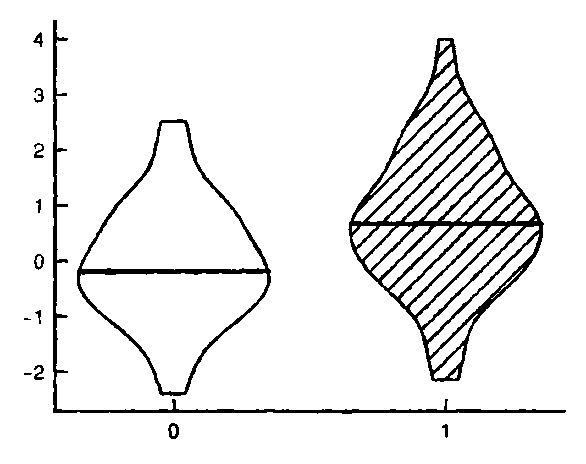
g.geom_violin(ax, [rng.normal(0, 1, 80), rng.normal(0.8, 1.3, 80)])
geom_violingeom_errorbar
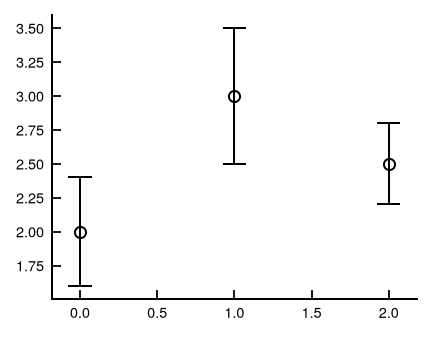
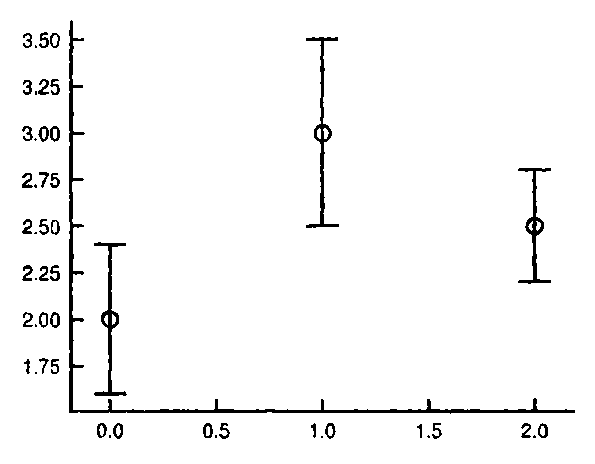
g.geom_point(ax, [0, 1, 2], [2, 3, 2.5])
g.geom_errorbar(ax, [0, 1, 2], [1.6, 2.5, 2.2], [2.4, 3.5, 2.8])
geom_point, geom_errorbargeom_errorbar (orientation='y')
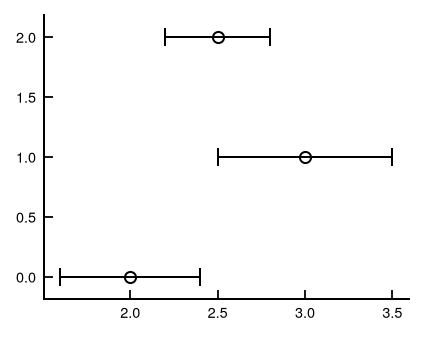
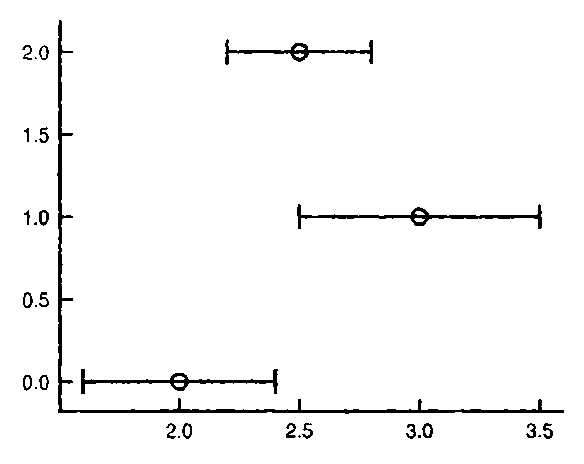
g.geom_point(ax, [2, 3, 2.5], [0, 1, 2])
g.geom_errorbar(ax, [0, 1, 2], [1.6, 2.5, 2.2], [2.4, 3.5, 2.8], orientation='y')
geom_point, geom_errorbargeom_linerange
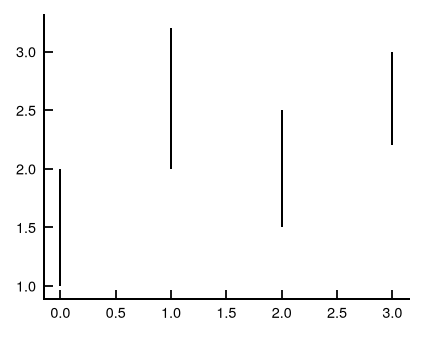
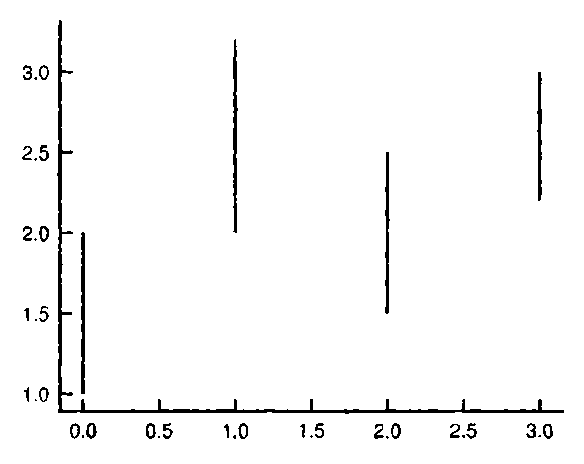
g.geom_linerange(ax, [0, 1, 2, 3], [1, 2, 1.5, 2.2], [2, 3.2, 2.5, 3])
geom_linerangegeom_pointrange
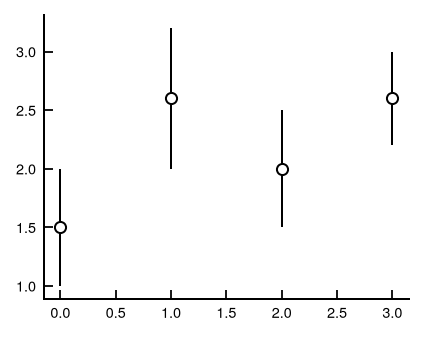
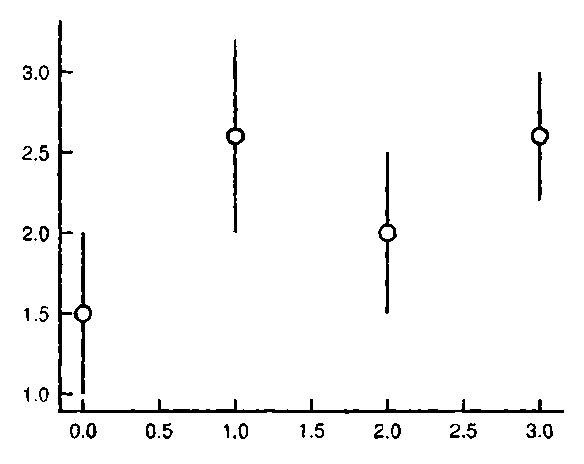
g.geom_pointrange(ax, [0, 1, 2, 3], [1.5, 2.6, 2, 2.6], [1, 2, 1.5, 2.2], [2, 3.2, 2.5, 3])
geom_pointrangegeom_crossbar
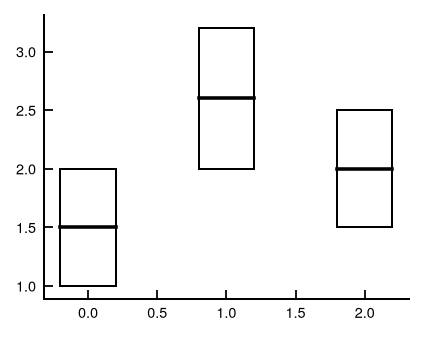
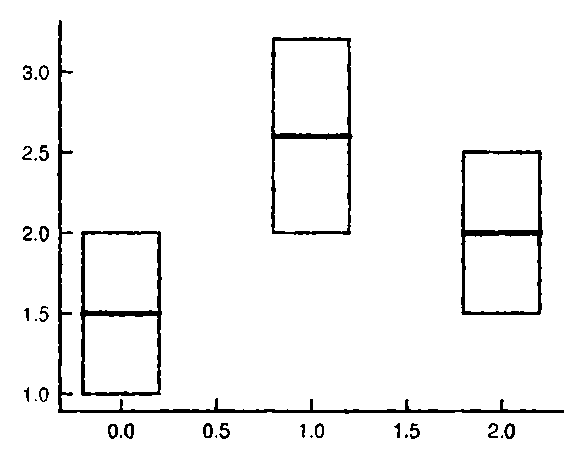
g.geom_crossbar(ax, [0, 1, 2], [1.5, 2.6, 2], [1, 2, 1.5], [2, 3.2, 2.5])
geom_crossbargeom_smooth (lm)
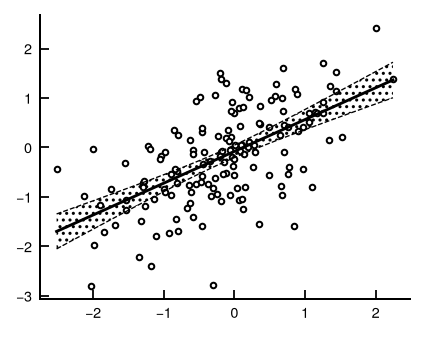
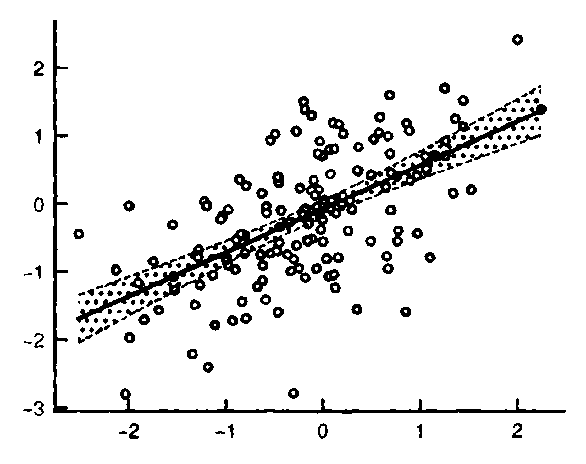
g.geom_point(ax, x, y, size=2.5)
g.geom_smooth(ax, x, y, method='lm')
geom_point, geom_smoothgeom_smooth (loess)
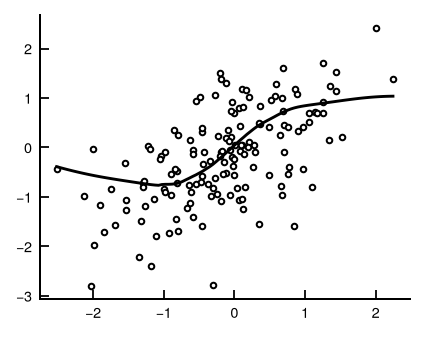
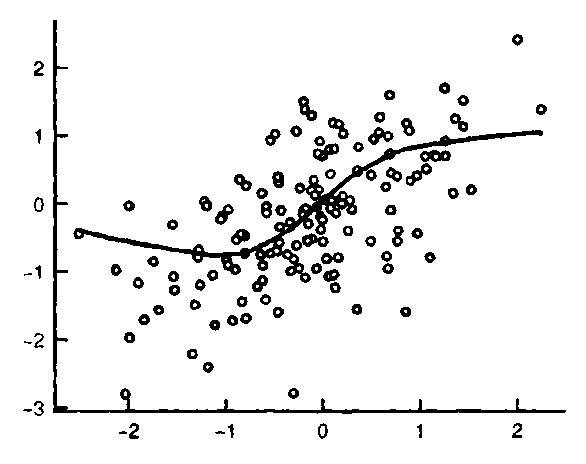
g.geom_point(ax, x, y, size=2.5)
g.geom_smooth(ax, x, np.sin(x * 1.5) + rng.normal(0, 0.4, 150), method='loess', se=False)
geom_point, geom_smoothgeom_quantile
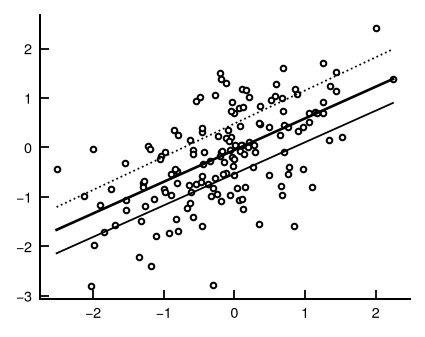
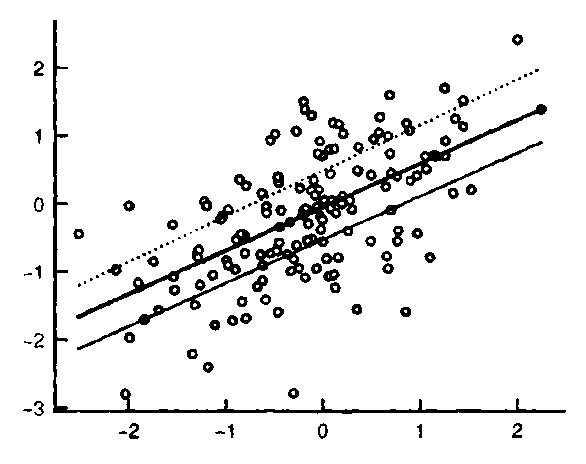
g.geom_point(ax, x, y, size=2.5)
g.geom_quantile(ax, x, y)
geom_point, geom_quantilegeom_qq + qq_line
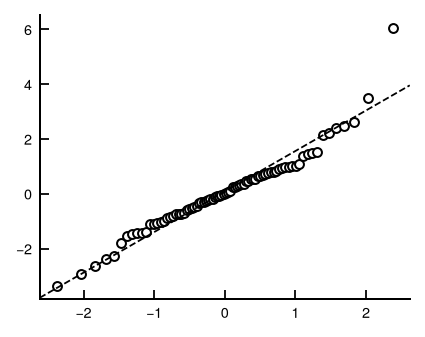
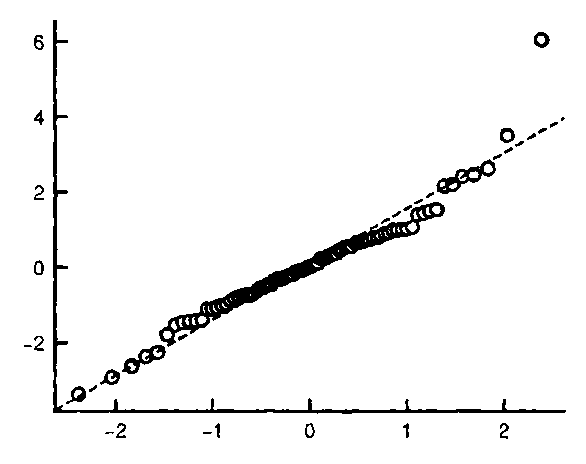
g.geom_qq(ax, rng.standard_t(4, 80))
g.geom_qq_line(ax, rng.standard_t(4, 80))
geom_qq, geom_qq_linegeom_density_2d
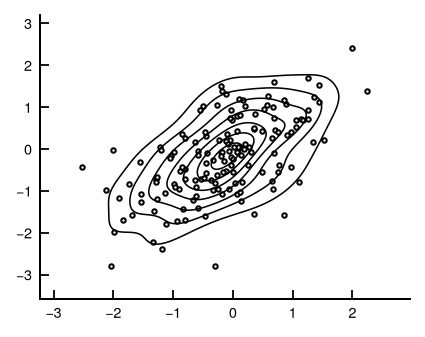
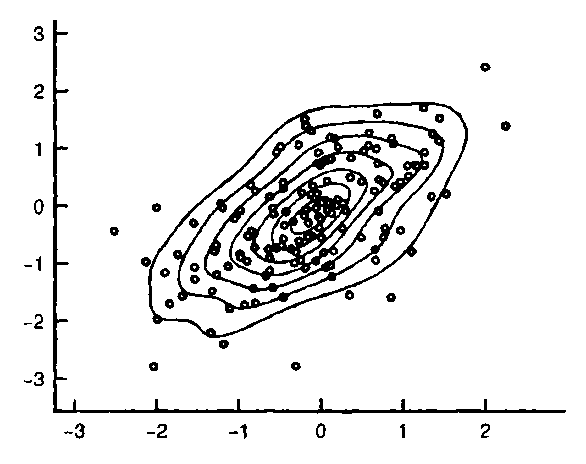
g.geom_point(ax, x, y, size=2)
g.geom_density_2d(ax, x, y)
geom_point, geom_density_2dgeom_density_2d_filled
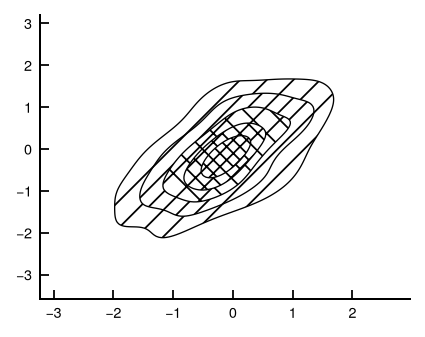
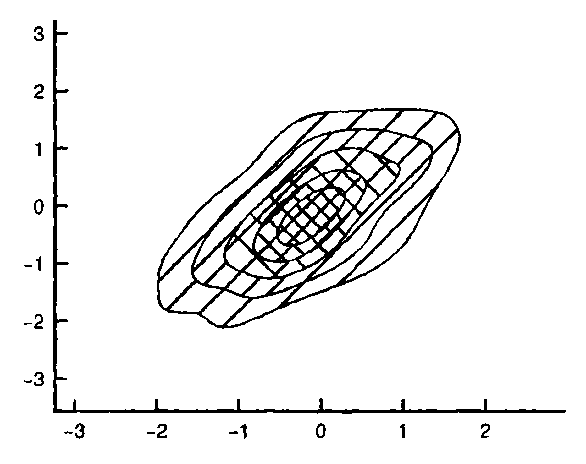
g.geom_density_2d_filled(ax, x, y)
geom_density_2d_filledgeom_contour
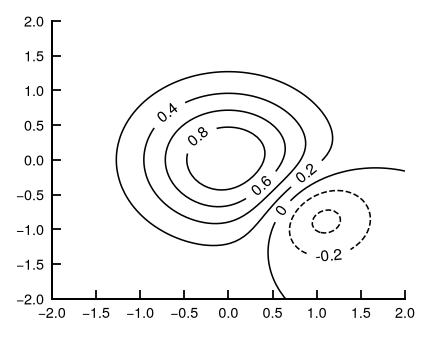
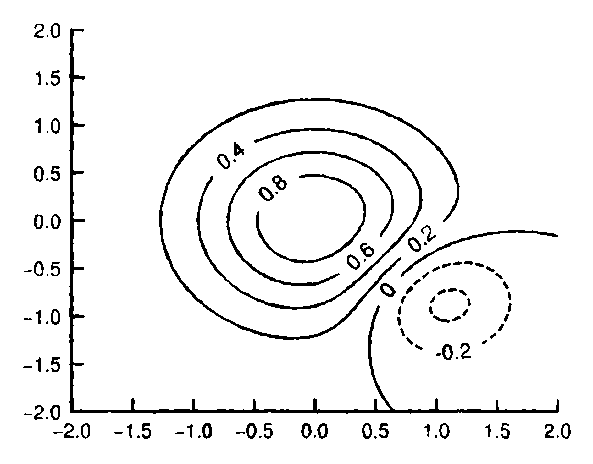
g.geom_contour(ax, X, Y, Z)
geom_contourgeom_contour_filled
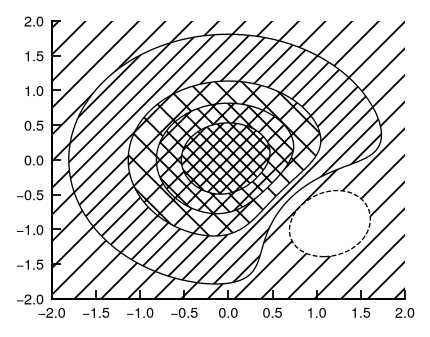
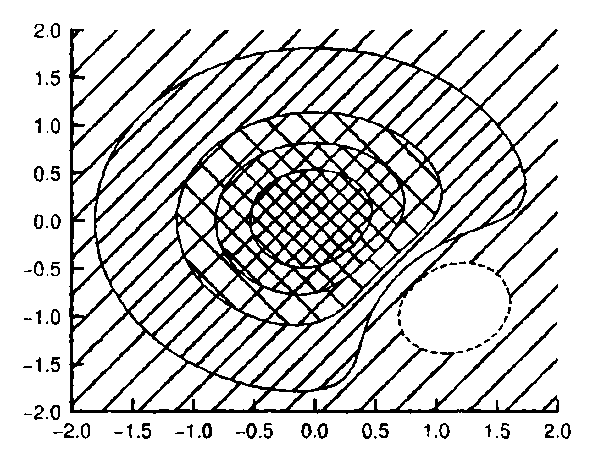
g.geom_contour_filled(ax, X, Y, Z)
geom_contour_filledgeom_bin_2d
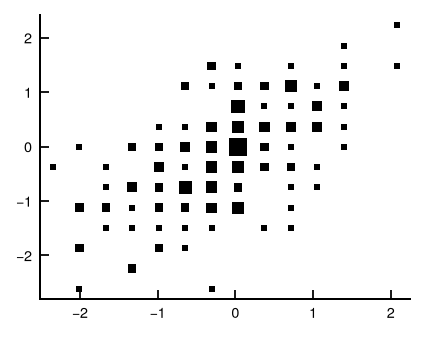
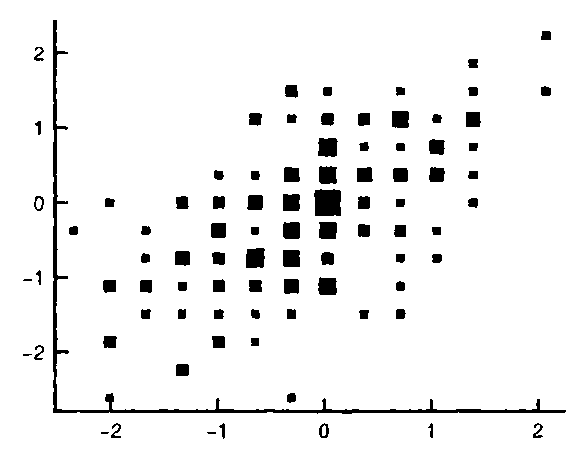
g.geom_bin_2d(ax, x, y, bins=14)
geom_bin_2dgeom_hex
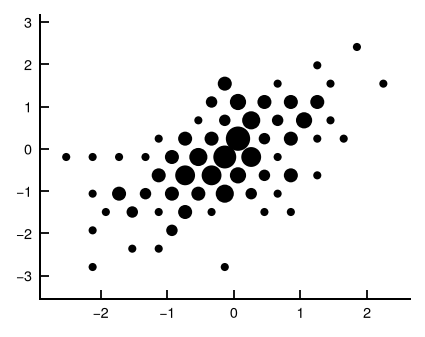
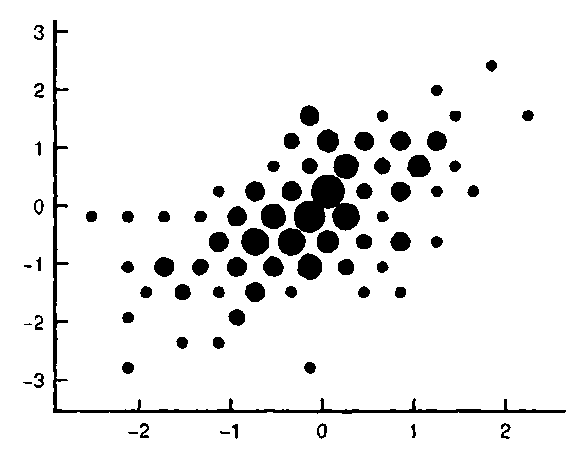
g.geom_hex(ax, x, y, gridsize=12)
geom_hexgeom_tile
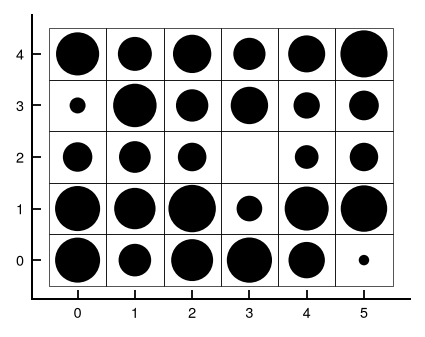
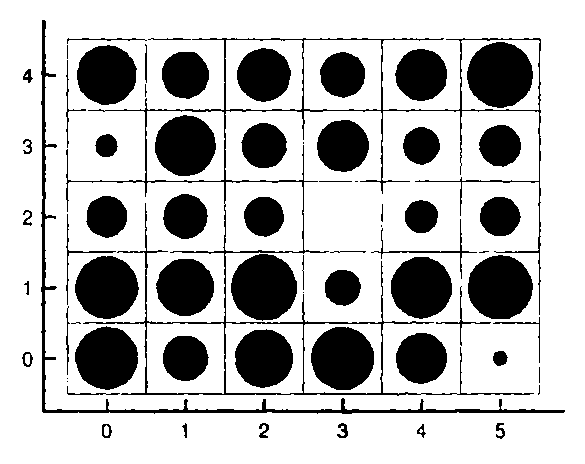
g.geom_tile(ax, np.tile(np.arange(6), 5), np.repeat(np.arange(5), 6), rng.random(30))
geom_tilegeom_raster
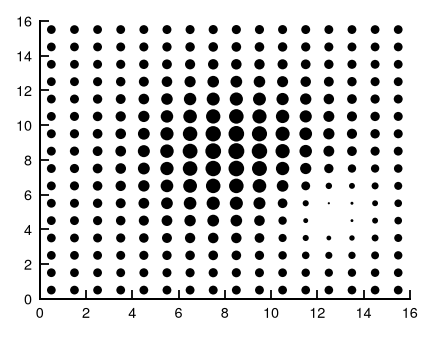
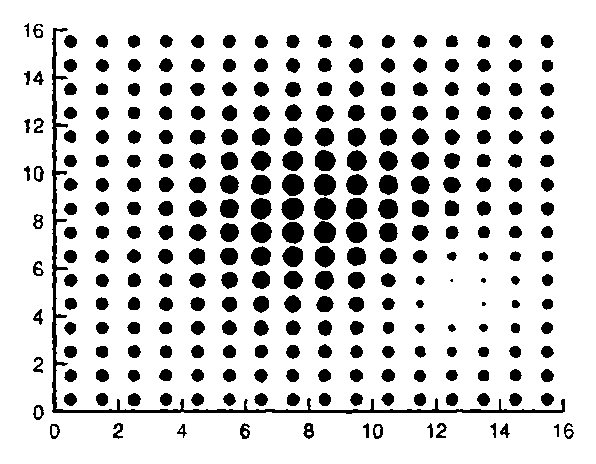
g.geom_raster(ax, Z[::5, ::5])
geom_rastergeom_text
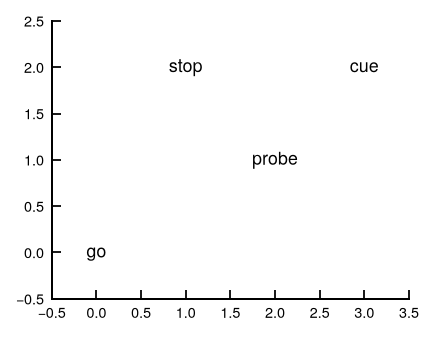
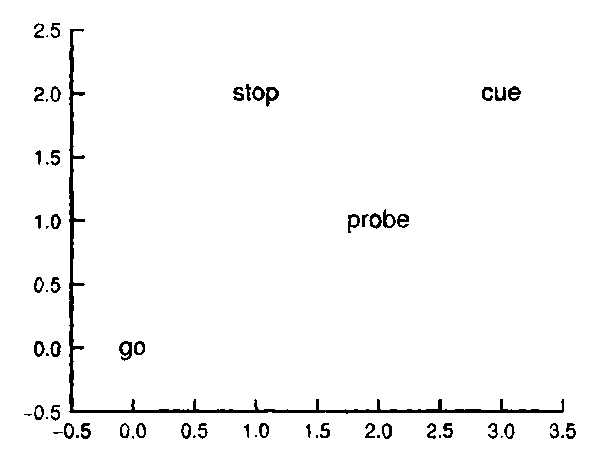
ax.set_xlim(-0.5, 3.5)
ax.set_ylim(-0.5, 2.5)
g.geom_text(ax, [0, 1, 2, 3], [0, 2, 1, 2], ['go', 'stop', 'probe', 'cue'])
geom_textgeom_label
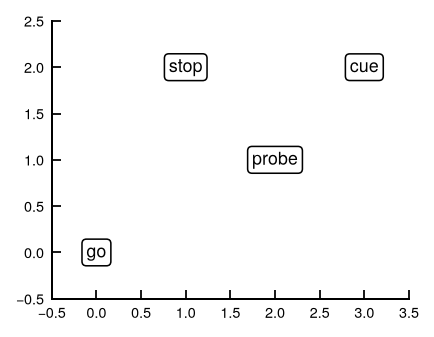
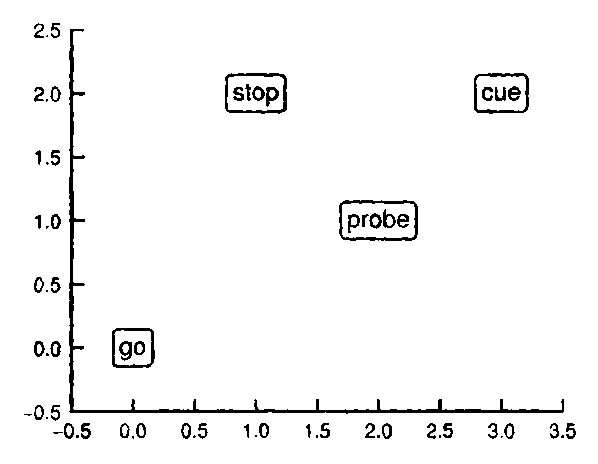
ax.set_xlim(-0.5, 3.5)
ax.set_ylim(-0.5, 2.5)
g.geom_label(ax, [0, 1, 2, 3], [0, 2, 1, 2], ['go', 'stop', 'probe', 'cue'])
geom_labelgeom_map
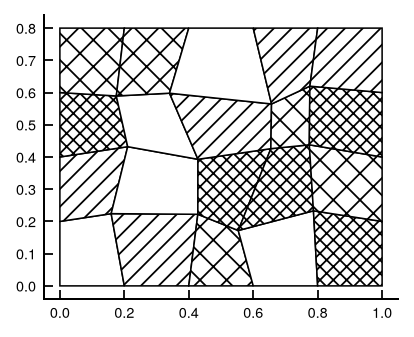
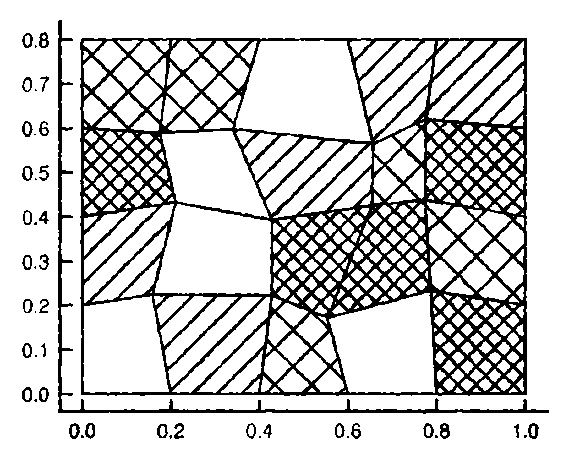
g.geom_map(ax, polys, rng.random(len(polys)))
geom_mapgeom_sf + sf_label
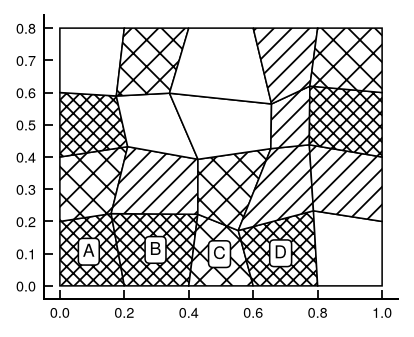
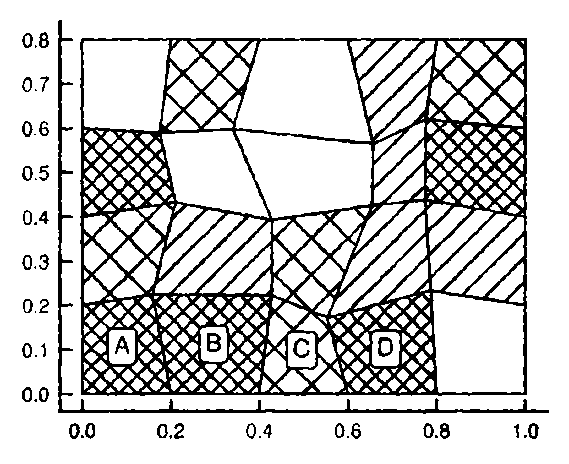
g.geom_sf(ax, polys, rng.random(len(polys)))
g.geom_sf_label(ax, polys[:4], ['A', 'B', 'C', 'D'])
geom_sf, geom_sf_labelgeom_sf + sf_text
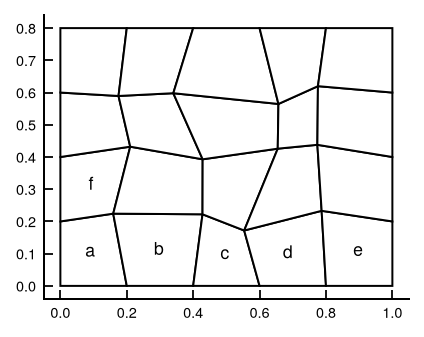
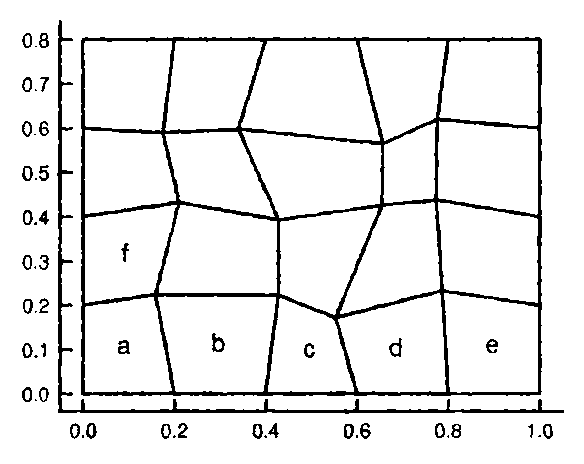
g.geom_sf(ax, polys)
g.geom_sf_text(ax, polys[:6], list('abcdef'))
geom_sf, geom_sf_textgeom_blank
g.geom_blank(ax)
geom_blank